In short
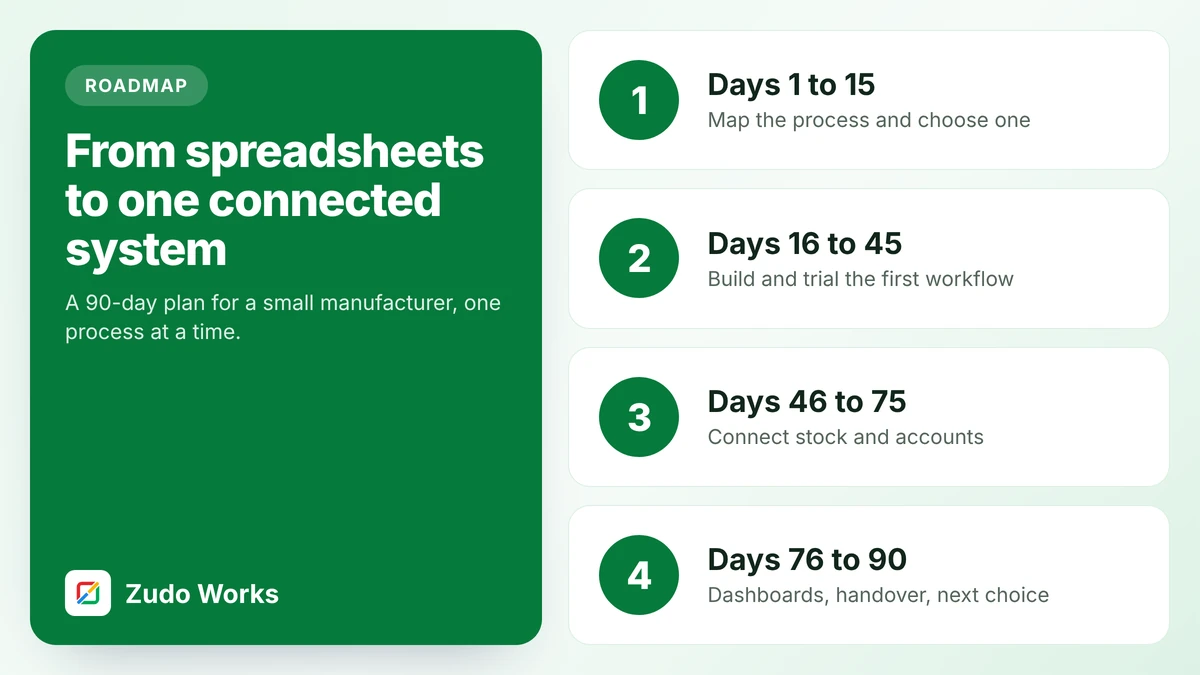
Map your processes in two weeks and choose one that hurts and is easy to fix. Build and trial that one workflow in a month, connect it to stock and accounts in the next month, then add dashboards and hand over. Retire the old spreadsheet on a named date, and repeat with the next process.
Spreadsheets are not the problem. They are the reason a small factory can run at all. The problem starts when the same information lives in five of them and nobody knows which is current.
This roadmap is for a manufacturer with roughly 10 to 150 people who wants to stop that without betting the business on one large system. It assumes no particular software, although the examples use Zoho apps because that is what we build on.
Why 90 days, and why one process
Ninety days is long enough to finish something real and short enough that people still remember why it started. One process is small enough to get right. Finishing matters more than scope: a team that has seen one process work will ask for the next one, and a team that has watched a big project stall will resist all of them.
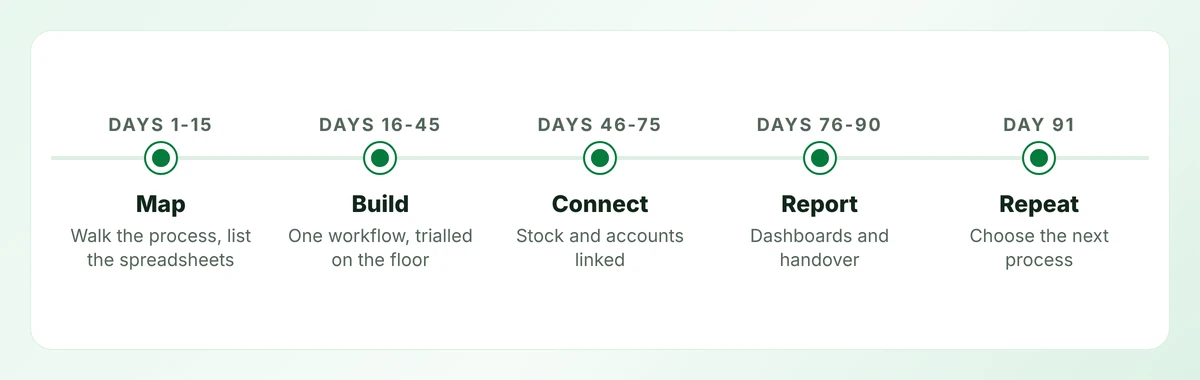
Days 1 to 15: map, then choose
Walk each process with the person who does it, and write down what actually happens, including the workarounds. For each one, note:
- which spreadsheets, whiteboards and paper forms it touches;
- where the same data is typed more than once;
- where people wait for information or go and look for it;
- what goes wrong, and how often.
Then rank the processes on two questions: how much does it hurt, and how hard is it to fix?
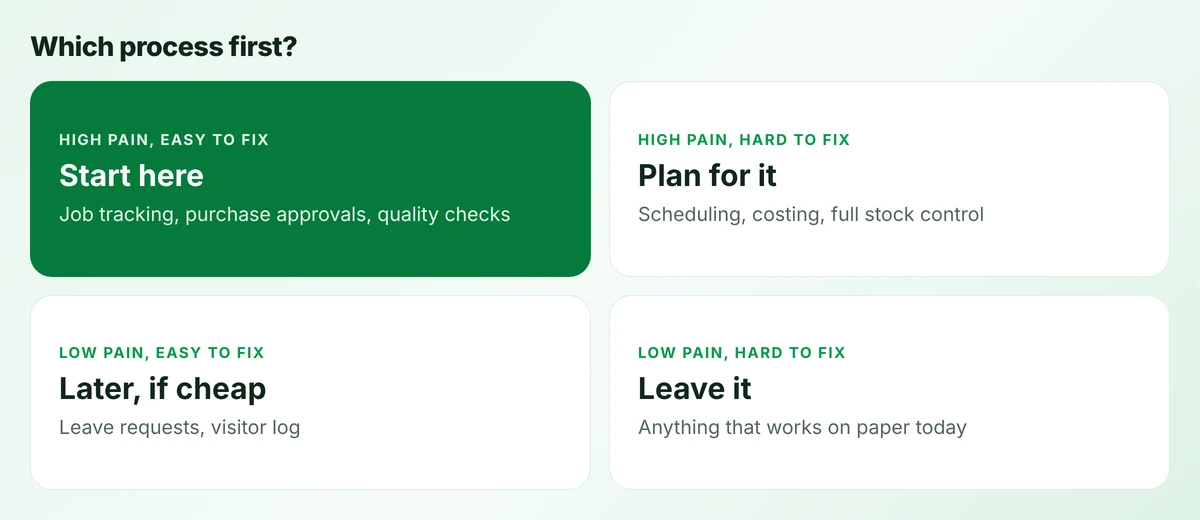
Start in the top-left quadrant. Job tracking, purchase approvals and incoming quality checks are common first choices because they are contained: few people, few integrations, visible result. Full stock control and scheduling hurt more but depend on data you may not have yet. Our guide to inventory accuracy explains why.
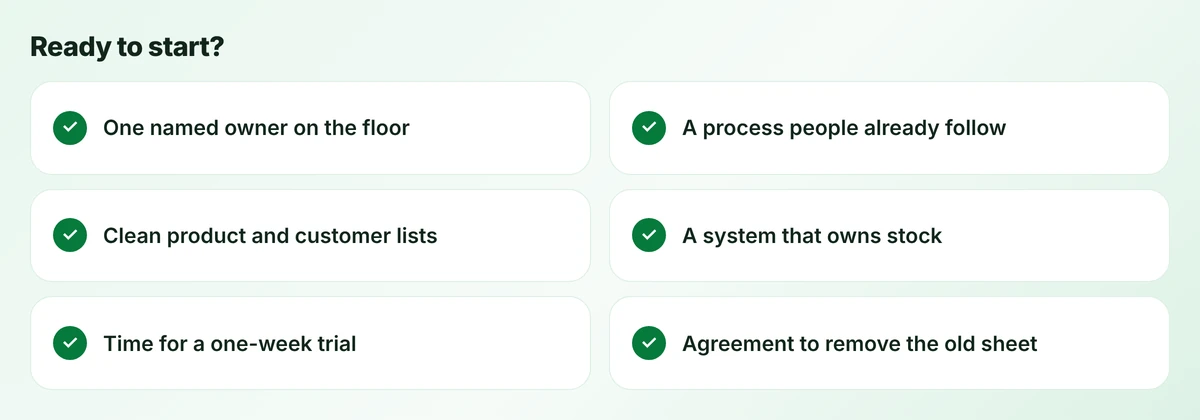
Days 16 to 45: build one workflow and trial it
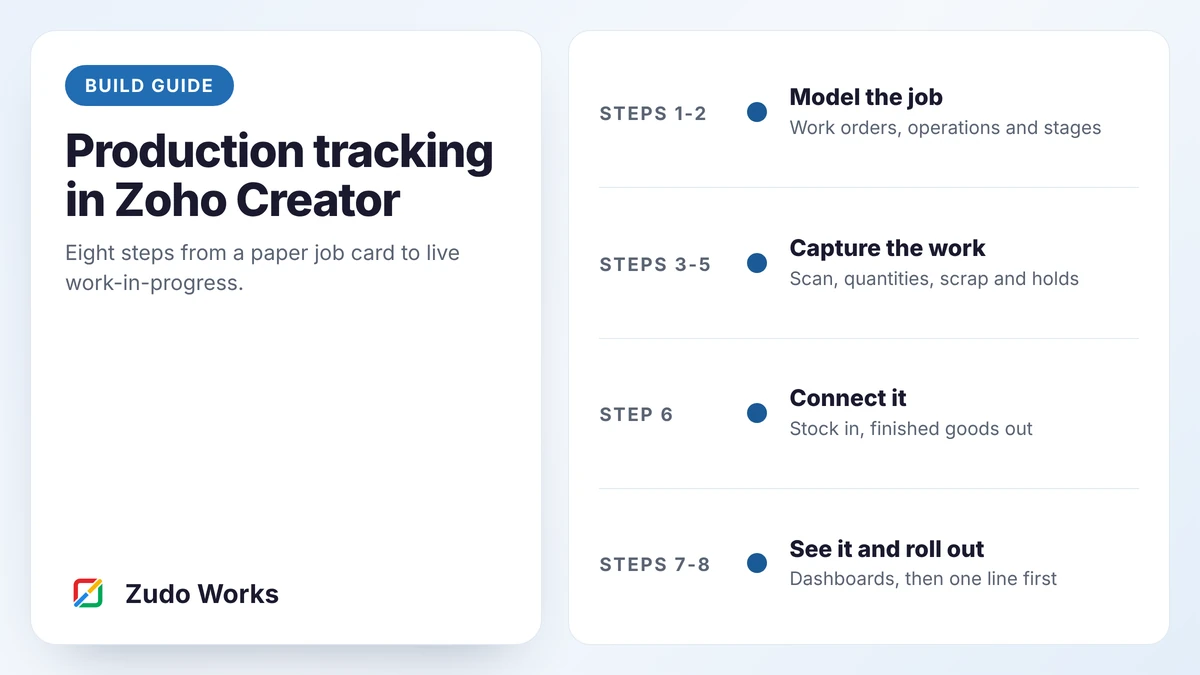
Build the smallest version that could replace the spreadsheet. For job tracking, that is work orders, stages and one operator screen. Our production tracking build guide lists the steps.
- Week 3: agree the data model and the two or three screens. Sketch them on paper with the people who will use them.
- Weeks 4 and 5: build. Review a working screen twice a week, on the floor, not in a meeting room.
- Week 6: run it beside the old method on one line. Fix what the trial shows.
The date that matters
Agree at the start the date on which the old spreadsheet becomes read-only. Without that date, both methods run in parallel for months and the new one is blamed for the extra work.
Days 46 to 75: connect stock and accounts
A workflow that stands alone still needs retyping at its edges. This phase removes the retyping.
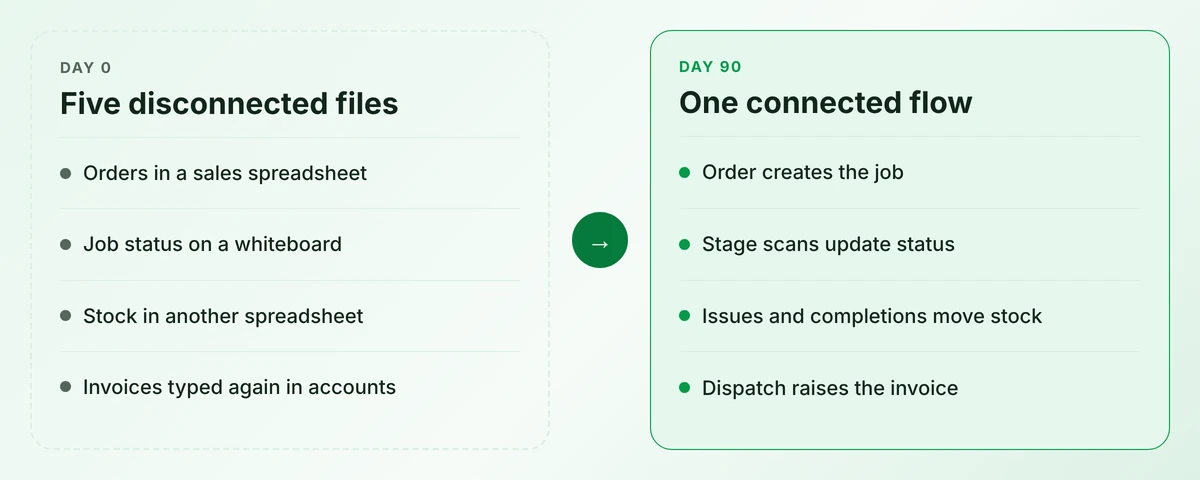
Typical connections for a first process:
- Orders in. A confirmed order creates the job.
- Stock out and in. Issues reduce components; completions add finished goods.
- Invoice out. Dispatch raises the invoice in your accounting system.
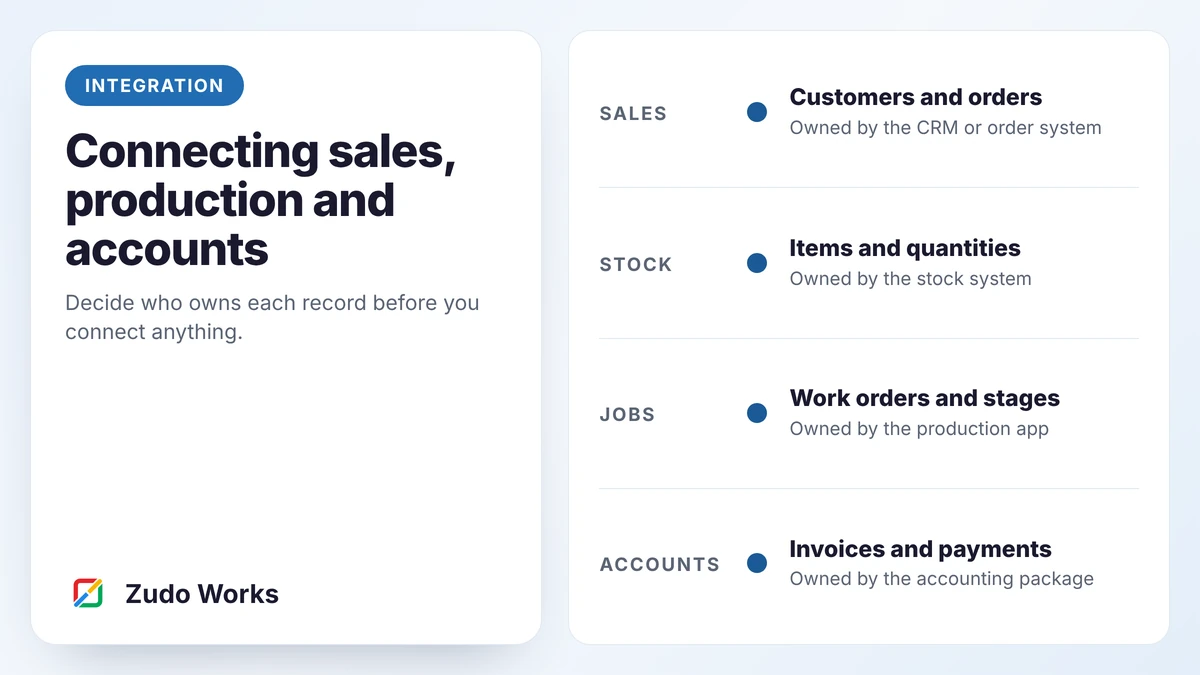
Keep each system as the owner of one thing: the accounting package owns invoices, the stock system owns quantities, the new app owns the work. Our guide to integration patterns covers how to keep them in step.
Days 76 to 90: report, hand over, choose again
Only now build dashboards. With a month of real data you know which questions people actually ask. Three or four measures are enough to begin with; see which KPIs are worth tracking.
Handover means three things in writing: what the system does, who can change it, and what to do when it is wrong. Then go back to the ranked list and choose the next process.
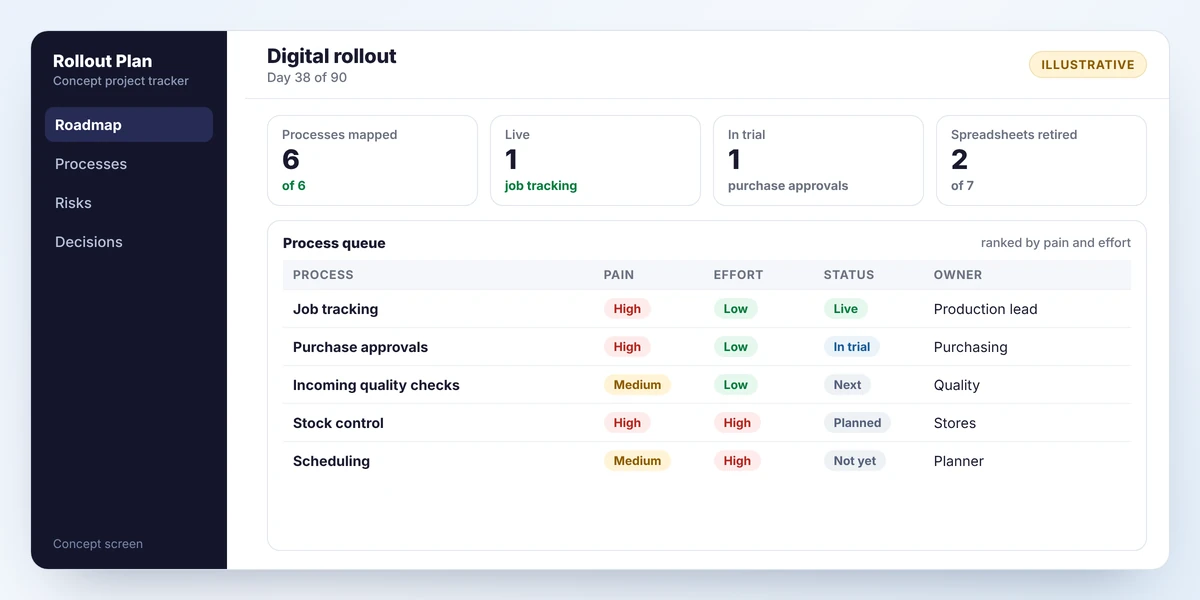
A worked example: what the 90 days look like
Here is the plan applied to an example business: a 30-person sheet-metal fabricator that quotes in one spreadsheet, schedules on a whiteboard and invoices from an accounting package.
- Days 1 to 15. The walk-through finds seven spreadsheets and one whiteboard. Scoring them shows that job status causes the most daily pain: the office phones the floor about a dozen times a day. Purchasing is painful too, but depends on stock figures nobody trusts. Job tracking is chosen.
- Days 16 to 45. A work-order app is built with five stages. The laser cell trials it for a week with printed job cards and one shared tablet. Two changes come out of the trial: operators want to see the next three jobs, not just the current one, and “waiting for material” needs to be a hold reason.
- Days 46 to 75. Confirmed quotes now create work orders, so nothing is typed twice. Completing a job creates a draft invoice in the accounting package. Stock is deliberately left alone, apart from a list of materials issued per job.
- Days 76 to 90. A weekly report shows jobs finished on time and hours on hold by reason. The whiteboard is taken down. The team scores the remaining processes again and picks purchasing, now that material issues are being recorded.
Notice what was not done. Nobody replaced the accounting package, nobody built a scheduling engine and nobody loaded a full stock file. Each of those may come later, with evidence from the first project to justify it.
How to tell whether it worked
Agree two or three plain measures before you start and take a baseline in the first fortnight. Good candidates are the number of status calls from the office to the floor, the time between finishing a job and invoicing it, and the number of jobs whose stage is unknown at 9 a.m. They are easy to count by hand, and they show whether people are using the system or working around it.
Who you need
- An owner from the floor. Someone the operators respect, with a few hours a week. This is the role projects most often lack.
- A builder. In-house or outside. One person who can change a screen the same day a problem is found.
- A decision-maker. Someone who can say “we stop using the old sheet on the 1st”.
How these projects go wrong
- Starting with the hardest process. Scheduling is tempting and depends on everything else being right.
- Copying the spreadsheet. A system with 40 columns is still a spreadsheet. Model the process, not the file.
- Designing in a meeting room. Screens designed away from the floor fail on the floor.
- No retirement date. Parallel running that never ends.
- Buying software before mapping. You end up changing the process to fit the tool.
What to do this week
List every spreadsheet that more than one person edits. That list is your map. Mark the one that causes the most arguments, and walk its process with the person who owns it. If you want a second opinion on where to start, our workflow overview shows the processes we are asked to fix most often.
Frequently asked questions
Not entirely, and that is not the aim. In 90 days you can move one complete process off spreadsheets and connect it to stock and accounts. Repeating the cycle moves the rest.
If you need planning, costing and finance in one system and your process fits a standard model, an ERP can be the right answer. If your main problem is a few disconnected processes, fixing those first is faster, cheaper and makes any later ERP decision better informed.
Someone from operations, not IT or accounts. The owner needs the respect of the people on the floor and the authority to retire the old method.
It depends on scope and integrations. We price from an estimate of hours, and our pricing page explains the rates and includes a calculator.
Sources
Product capabilities change. We checked these pages in October 2026; confirm anything you plan around.
Related services: Manufacturing workflows · Business process automation · Pricing