Analytics
Getting Your Data Ready for AI in Zoho Analytics: A Practical Foundation
AI features in analytics tools are impressive in demos and disappointing on messy data. Before you ask Zia a question about revenue, make sure the answer can be right. This is how we set up Zoho Analytics so dashboards and AI insights can be trusted.

Quick answer
To get reliable dashboards and AI answers from Zoho Analytics, connect sources with native connectors, join tables on a shared customer ID, clean data where it is created, and define key metrics once as query tables. Only then rely on Ask Zia, and check its answers against a trusted report.
Zoho Analytics can pull data from Zoho CRM, Books, Desk, Creator and hundreds of other sources, then turn it into reports, dashboards and answers to questions typed in plain English. That last part, Ask Zia, is where many teams start. It is also where bad data becomes visible fastest.
When an executive asks “what was revenue by region last quarter?” and gets a number that doesn’t match the finance report, trust in the whole system drops. The fix is not a better AI. It is a better foundation.
1. Connect the right sources, in the right way
Zoho Analytics has native connectors for Zoho apps and for many common business systems and databases, plus file imports and APIs for everything else. A few rules keep things manageable:
- Prefer native connectors over file uploads. They sync on a schedule, so dashboards stay current without anyone remembering to re-upload a spreadsheet.
- Bring in only what you will use. Importing every module from every app slows syncs and clutters the workspace.
- Choose sync frequency per source. Sales pipeline data may need refreshing several times a day; accounting data after each day’s close is usually enough. Faster syncs depend on your plan.
- Keep one workspace per subject area (sales, finance, support) or one combined workspace with clear folders, rather than many overlapping copies.
2. Model the data so it joins correctly
Most wrong numbers come from joins, not formulas. When CRM deals, Books invoices and Desk tickets sit in one workspace, Analytics needs to know how they relate.
- Define lookup columns between tables, for example invoice customer to CRM account, so reports can blend data automatically.
- Agree on one customer key. If CRM and Books use different customer IDs, store the Books ID on the CRM account (a small Deluge function can keep it in sync) and join on that.
- Use query tables (SQL views inside Analytics) for logic that many reports share, such as “active customers” or “net revenue”. Define it once and every report agrees.
- Watch for many-to-many joins that double-count values, such as joining deals to contacts when a deal has several contacts.
3. Clean data at the source, not in the dashboard
It is tempting to fix messy values with formulas in Analytics. That works until the next report, which needs the same fix. Clean data where it is created instead:
- Use picklists instead of free text for region, industry, lead source and product category.
- Make fields mandatory at the stage where they become known, using layout rules or Blueprint.
- Deduplicate accounts and contacts in the CRM.
- Standardize dates, currencies and units across systems.
When a value can only be fixed in Analytics, add a clearly named formula column and document it, so the next person understands where the number comes from.
4. Define your metrics in writing
“Revenue” can mean bookings, invoiced amount or cash received. “Active customer” can mean bought this year or has an open subscription. AI tools cannot resolve that ambiguity for you.
Write a one-page glossary of your key metrics, with the exact table, filter and formula behind each. Then build those definitions as query tables or aggregate formulas in Analytics and use them everywhere. Natural-language questions become far more reliable when the underlying columns have clear names and consistent meanings.
5. Secure the data before sharing it
- Share dashboards, not raw tables, with most users.
- Use user filters (row-level security) so sales reps or regional managers only see their own data.
- Review who has workspace admin rights regularly, especially when people change roles.
- Be deliberate about AI access to sensitive data such as salaries or customer personal information, and follow your data-protection obligations in each country you operate in.
6. Then use the AI features
With the foundation in place, Zoho Analytics’ AI features become genuinely useful:
- Ask Zia answers natural-language questions with charts, which is ideal for quick questions that don’t justify a new report.
- Zia Insights generates plain-language summaries of a chart, such as the biggest contributors to a change.
- Forecasts and anomaly detection highlight trends and unusual movements worth investigating.
Treat AI answers like a capable new analyst: fast and helpful, but worth checking against a trusted report until you have seen it get things right consistently.
A one-week starter checklist
- List the five questions leadership asks most often.
- Identify the systems and fields that answer each one.
- Connect those sources with native connectors and sensible sync schedules.
- Set up lookups between tables and one customer key.
- Write metric definitions and build them as query tables.
- Build one dashboard that answers the five questions, with user filters.
- Only then, try Ask Zia on the same questions and compare answers.
Need help connecting Zoho Analytics to your CRM, Books or other systems? See our Zoho integrations service.
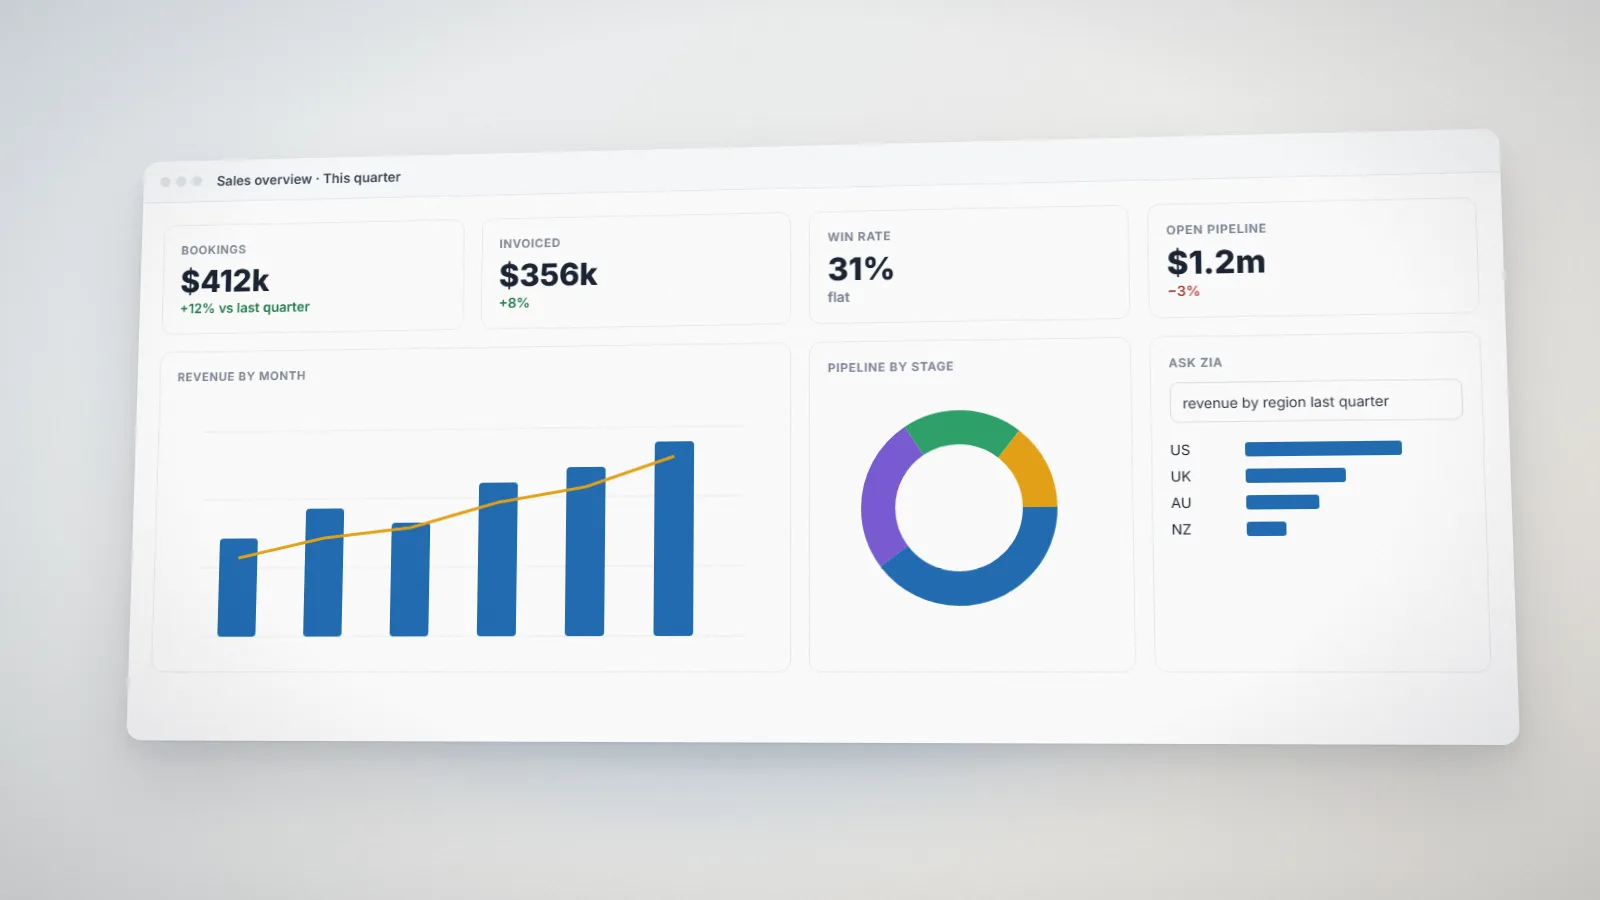
Example: a sales leader’s weekly dashboard
A dashboard that leadership actually opens every week usually has no more than eight widgets:
- Bookings this month versus target, from CRM deals marked won.
- Invoiced and collected revenue, from Zoho Books, joined to CRM accounts.
- Pipeline by stage and expected close month, weighted by probability.
- Deals with no activity in 14 days, as a table with owners.
- Win rate and average sales cycle by lead source.
- Top accounts by revenue with open support tickets from Zoho Desk.
Each widget is built on a documented metric, filtered by user so regional managers see their region. That dashboard also becomes the reference for checking Ask Zia’s answers.
Common mistakes we fix
- Several versions of the same table, imported at different times by different people. Keep one connected source per system.
- Formula fixes copied into every report. Move shared logic into query tables.
- Revenue counted twice because of joins to tables with several rows per deal.
- Dashboards nobody owns. Give each dashboard an owner who reviews it quarterly.
- Unlimited sharing of workspaces with raw customer data.
Simple routines that keep data trustworthy
- A monthly check that sync jobs are running and record counts match the source systems.
- A quarterly review of unused reports, dashboards and users with access.
- A change log for metric definitions, so everyone knows when and why a number changed.
Frequently asked questions
Ask Zia is the natural-language assistant in Zoho Analytics. You type a question such as "revenue by region last quarter" and it builds a chart or table from your data. Its accuracy depends on clean, well-named and correctly joined data.
Connect both apps with their native connectors, then define lookup relationships between related tables, ideally on a shared customer ID. Reports can then blend deals, invoices and payments, and query tables can hold shared metric definitions.
Native connectors sync on a schedule you choose. The fastest available frequency depends on your Zoho Analytics plan. Many teams sync sales data several times a day and accounting data daily.
Related services: Zoho integrations · Zoho development · Business process automation